Jump to your topic of interest:
Available Products
To view complete details, including ordering information, please use the links below.
- Chromeo™ 488 Tools for STED Microscopy
- Chromeo™ 505 Tools for STED Microscopy
- Chromeo™ 494 Tools for STED Microscopy
How STED microscopy overcomes the Abbe limit
The resolution attainable in IF experiments has until recently been limited by a very specific physical property known as the Abbe Law of Diffraction Limiting Resolution. The Abbe limit restricts the ability of the observer to visually resolve objects separated by less than ~200 nm. With STimulated Emission Depletion (STED) microscopy, however, it is possible to exceed the Abbe limit and achieve resolution improvements of up to 12-fold over classical confocal microscopy.
As shown in Figure 1A, all of the dye molecules within the excitation spot emit fluorescent light that is recognized as a single signal by the detector of the microscope; the individual dye molecules can't be resolved separately. In STED microscopy the dye molecules in the outer area of the spot are turned off through use of a second red-shifted "depletion" laser that emits a doughnut-shaped beam. As a result, only dye molecules in the very center of the excitation spot are able to emit a fluorescent signal, which reduces the size of the emitting spot below the diffraction limit (Figure 1B).
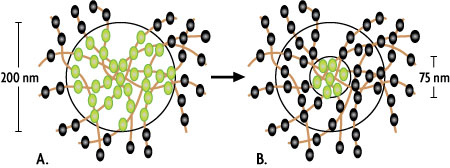
Figure 1: Principle of STED microscopy.
Illustration of a 200 nm excitation spot of a classical confocal microscope (A) or the downsized emitting spot (~75 nm) created by a STED microscope (B, inner ring). The spheres represent individual dye molecules in fluorescent (green) or "off" mode (black).
To turn the excited dye molecules off, the STED microscope contains two lasers that function in a well-coordinated, paired fashion. As shown in the Jablonski diagram in Figure 2, the excitation laser stimulates the dye molecules to their excited, fluorescent state S1. A second red-shifted depletion laser stimulates the dyes to return down to the ground state S0 without emitting fluorescence. Because the depletion laser has a doughnut-shaped beam, the dye molecules in the center of the excitation spot are not targeted by the depletion laser, so only they can emit detectable fluorescence.
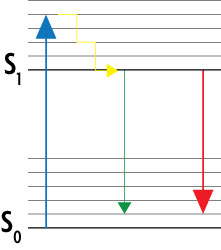
Figure 2: Simplified Jablonski diagram of the STED method.
Optimized sample preparation for STED microscopy
Leica recommends Active Motif Chromeon’s Chromeo™ 488, Chromeo™ 505 and Chromeo™ 494 fluorescent dyes and secondary antibody conjugates and its fluorescent ATTO (STED) secondary antibody conjugates for use with its instruments because they meet the specifications required for STED microscopy.
Figure 3: Comparison of conventional, confocal microscopy and STED microscopy.
Vimentin and clathrin were visualized by immunohistological co-staining. The image on the left was prepared using a confocal microscope, while that on the right was produced using a STED microscope. The STED image shows the cell structure proteins much more clearly, and enables discrimination between single filaments. Images courtesy of Leica Microsystems, Germany.
Publications
The use of Chromeo dyes and Fluorescent Antibodies in super-resolution STED microscopy has been described in the following publications:
- “Dual-Color STED Microscopy at 30-nm Focal-Plane Resolution” by Meyer et al (2008) Small 4(8):1095-1100. (Chromeo 488)
- “STED microscopy with a MHz pulsed stimulated-Raman-scattering source” by Rankin et al (2009) Optics Express 17(18):15679-15684. (Chromeo 488)
- “Fast STED microscopy with continuous wave fiber lasers” by Moneron et al (2010) Optics Express 18(12):1302-1309. (Chromeo 488)
- “Direct Synthesis of Lamin A, bypassing Prelamin A processing, Causes Misshapen Nuclei in Fibroblasts but No Detectable Pathology in Mice” by Coffinier et al (2010) J Biol. Chem. 285(27):20818-20826. (ATTO 647N)
- “Confocal Imaging at the Nanoscale with Two-Color STED Microscopy” by Pellett et al (2011) Proc. of SPIE 7905x. (Chromeo 494 and ATTO 647N)
- “Two-color STED microscopy in living cells” by Pellett et al (2011) Biomed. Optics Express 2(8):2364-2371. (Chromeo 494)
- “Sharper low-power STED nanoscopy by time gating” by Vicidomini et al (2011) Nature Methods 8:571-573. (Chromeo 488)
- “Novel Roles of Caenorhabditis elegans Heterochromatin Protein HP1 and Linker Histone in the Regulation of Innate Immune Gene Expression” by Studencka et al (2012) Mol. Cell. Biol. 32:251-265. (Chromeo 488)
- “Local palmitoylation cycles define activity-regulated postsynaptic subdomains” by Fukata et al (2013) J. Cell. Biol. 202(1):145-161. (Chromeo 505)
- “Fast neurotransmitter release regulated by the endocytic scaffold intersectin” by Sakaba et al (2013) PNAS 110(20):8266-8271. (Chromeo 494)
- “Super-resolution microscopy of the neuronal calcium-binding proteins Calneuron-1 and Caldendrin” by Hradsky et al (2013) Methods in Mol. Biol. 963:147-167. (Chromeo 494)