RRBS Service の概要
Reduced Representation Bisulfite Sequencing (RRBS) は、Whole Genome Bisulfite Sequencing (WGBS) よりも低コストで、ビーズアレイベースのDNAメチル化プラットフォームよりも高いカバレッジと少ないバイアスにより、1塩基対の分解能でDNAメチル化データを取得します。
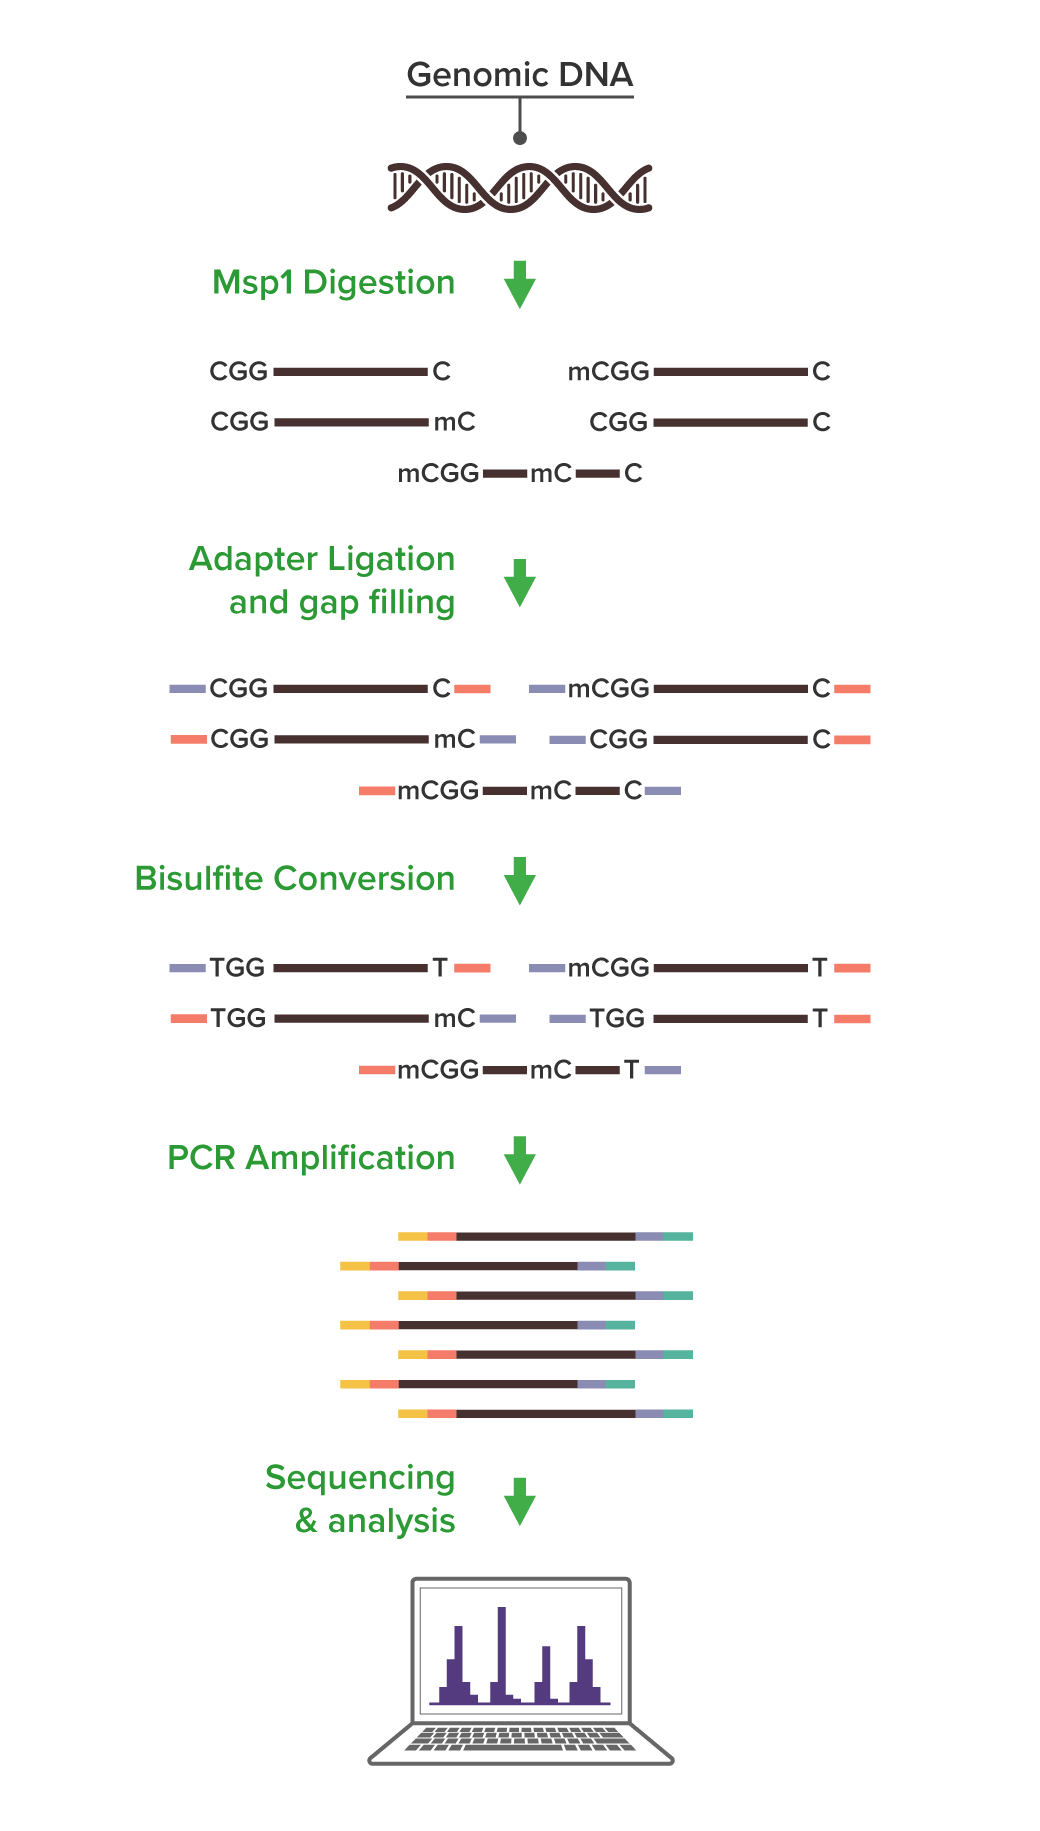
RRBSは、CpGを含むDNAを選択的に分離するための手法で、DNAを制限酵素で切断し、 300 bp未満の断片を選択・増幅してシーケンス解析を行います。簡潔に言うと、メチル化に影響されない制限酵素を用いて、CpGの位置でDNAを切断します。CpGアイランドやプロモーター領域はCpGの密度が高いため、これらの領域では高頻度で切断が起こり、そこから得られる断片は短くなる傾向があります。ライブラリを PCR により生成する際には、このような短い断片が優先的に増幅され、さらにシーケンシングのクラスター生成中にも選択が行われます。最終的にシーケンスされるDNA断片は、全ゲノムのごく一部ですが、CpGが濃縮された領域を解析することになります。
RRBS の特長:
- ヒト由来サンプルの場合、最大400万CpGのメチル化データを取得可能
- プロモーターおよびCpGアイランドを含む生物学的に関心のある標的領域の情報
- 50,000,000リード以上のペアエンドシーケンス
- DNAの必要量はわずか 100 ng
- ランダムなバーコードの組み込みによりPCR重複を除去し、ライブラリのバイアスを軽減
納品物:
- FASTQファイル
- BAMファイル
- 各CpGのメチル化率データ
- 差分メチル化解析
- 図表 (カバレッジ深度分析、相関プロット、パイチャートを含む)
RRBS Service受託解析サービスのデータ
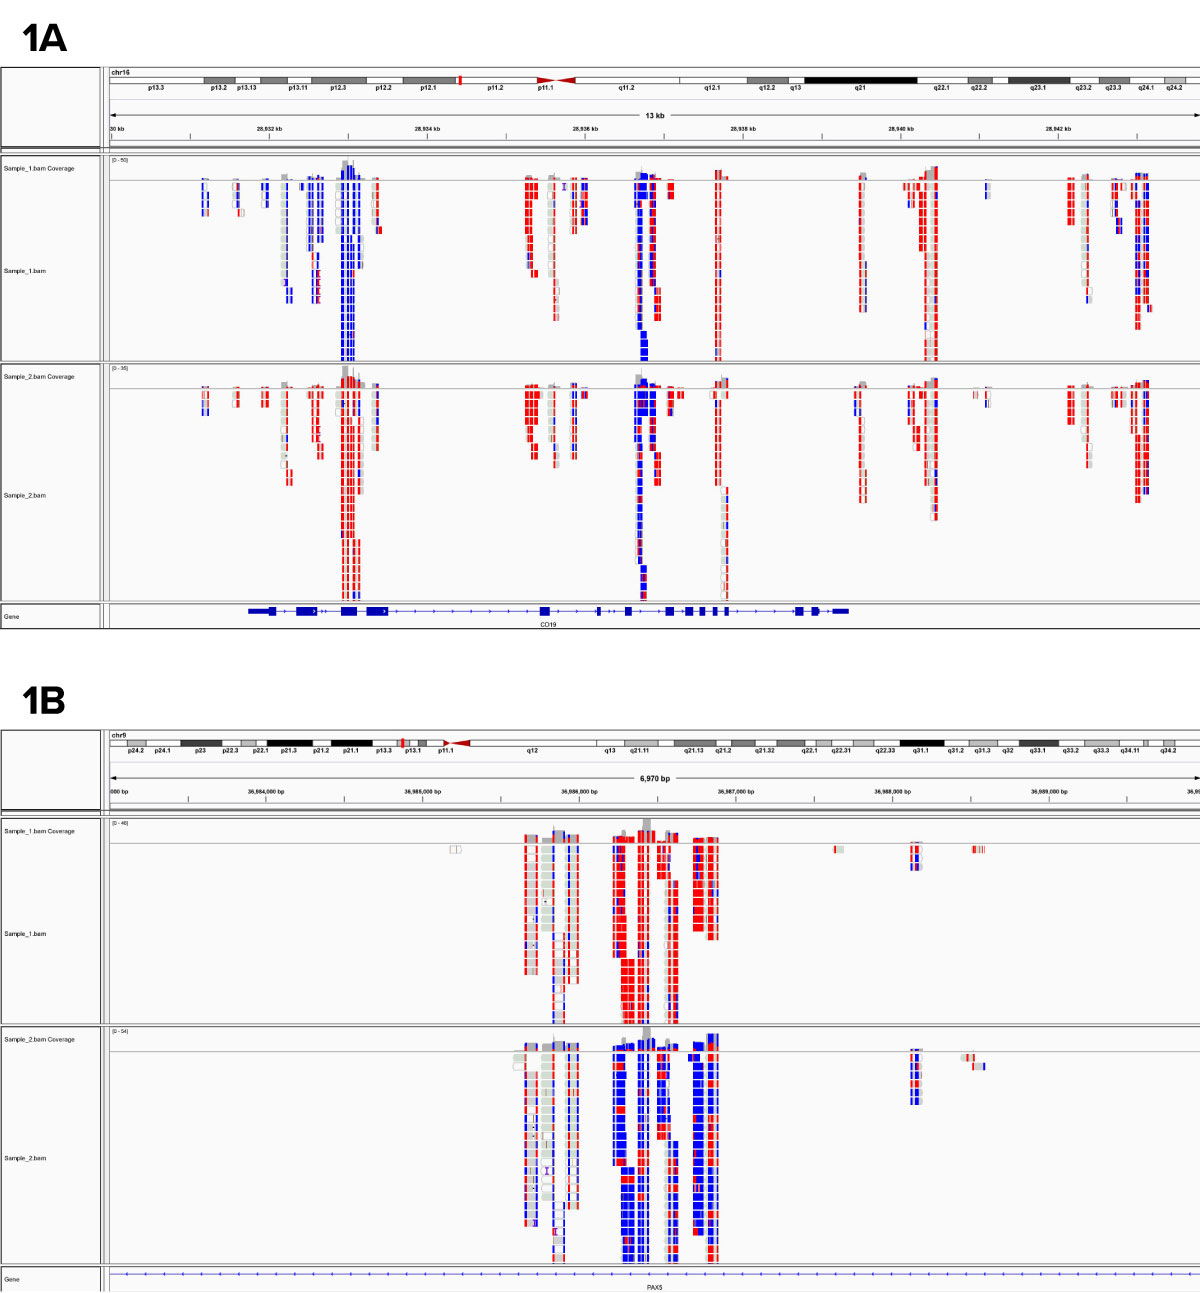
Fig. 1: ヒト試料から得られたRRBSによる解析データ
表示された領域は、ゲノムワイドデータセットからの代表的な領域であり、1A : CD19のエクソンと1B : PAX5のイントロンにおけるDNAメチル化の差異を示している。各ブロックは別々のデータポイントで、赤はメチル化されたシトシン、青はメチル化されていない塩基を表す。
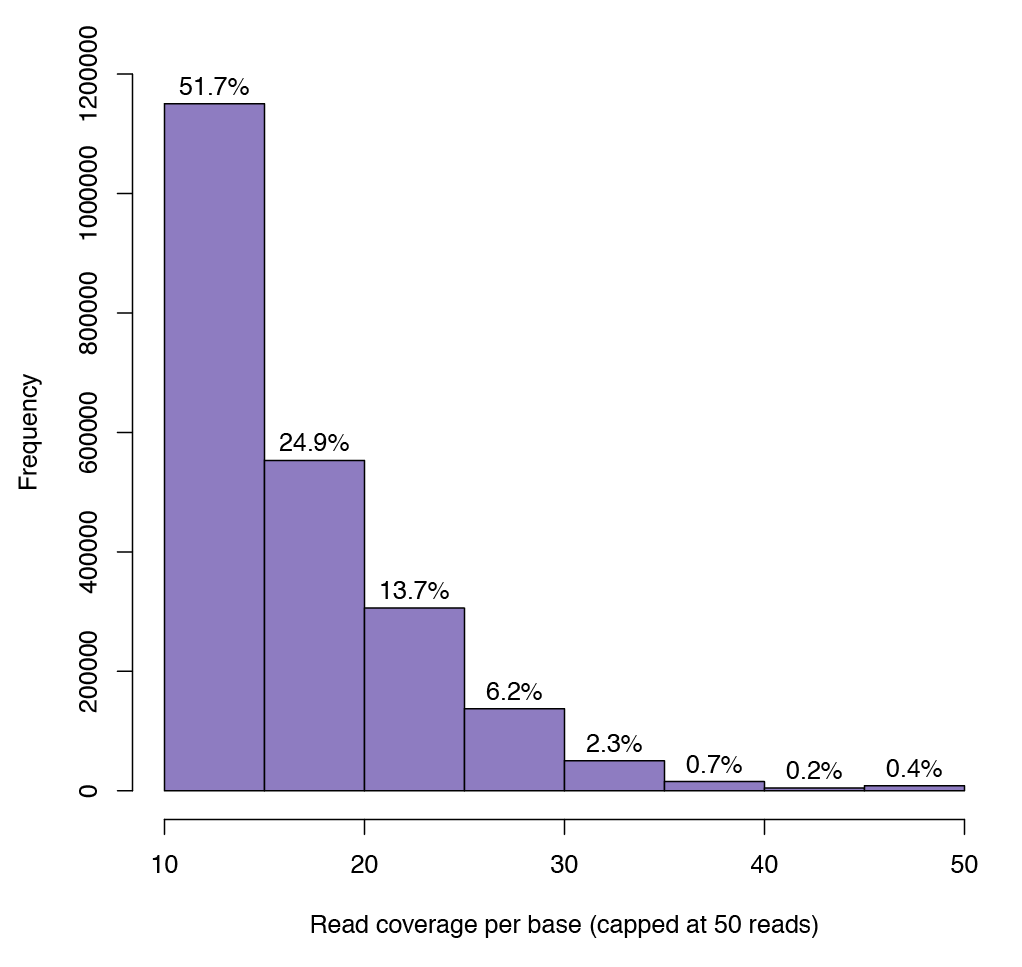
Fig. 2: 任意のCpGにおけるシーケンス深度カバーレッジを示したグラフ
解析に含まれるCpGのシーケンス深度の最小値は10であり、100万以上のCpG部位が少なくとも10リードのカバレッジであることが確認できる。
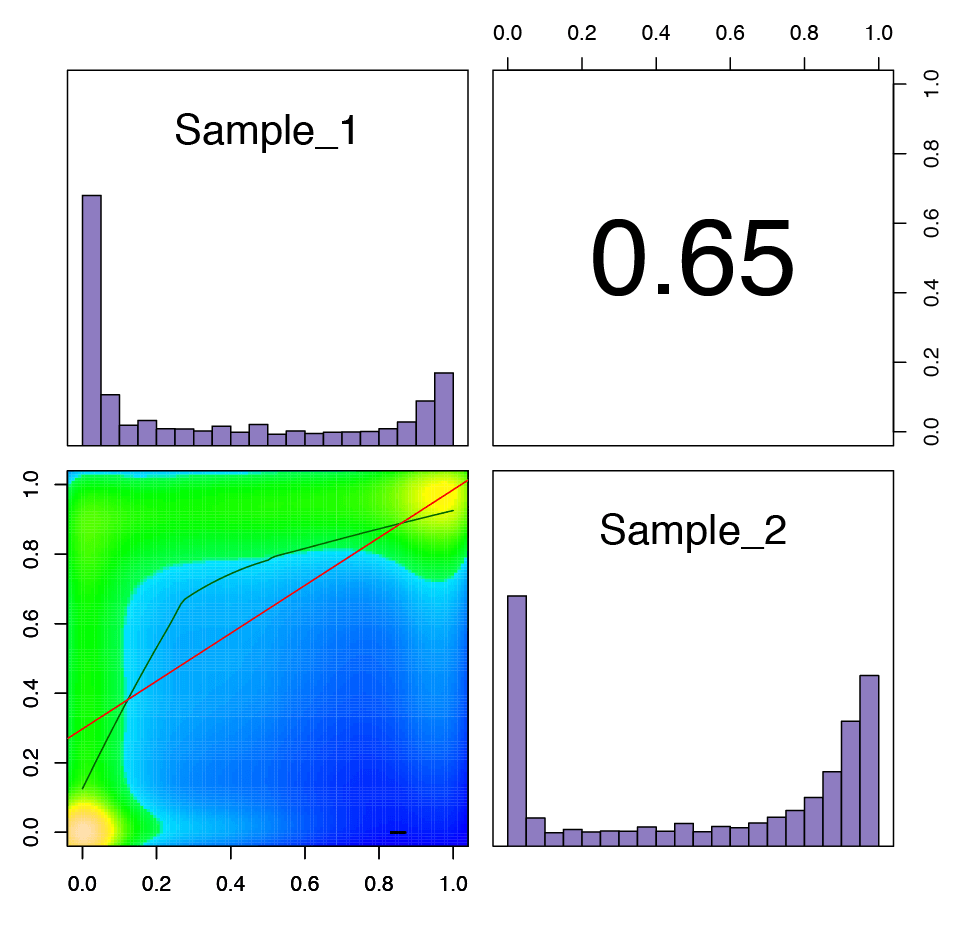
Fig. 3: サンプル間の相関を比較したグラフ
右上は2つのサンプルのピアソン相関係数を示す。棒グラフは、各サンプルにおけるメチル化率の分布を示し、解析されたCpG部位の大半はメチル化率が0か100%であった。左下の散布図は、各サンプルの共有CpG部位におけるメチル化レベルを示している。
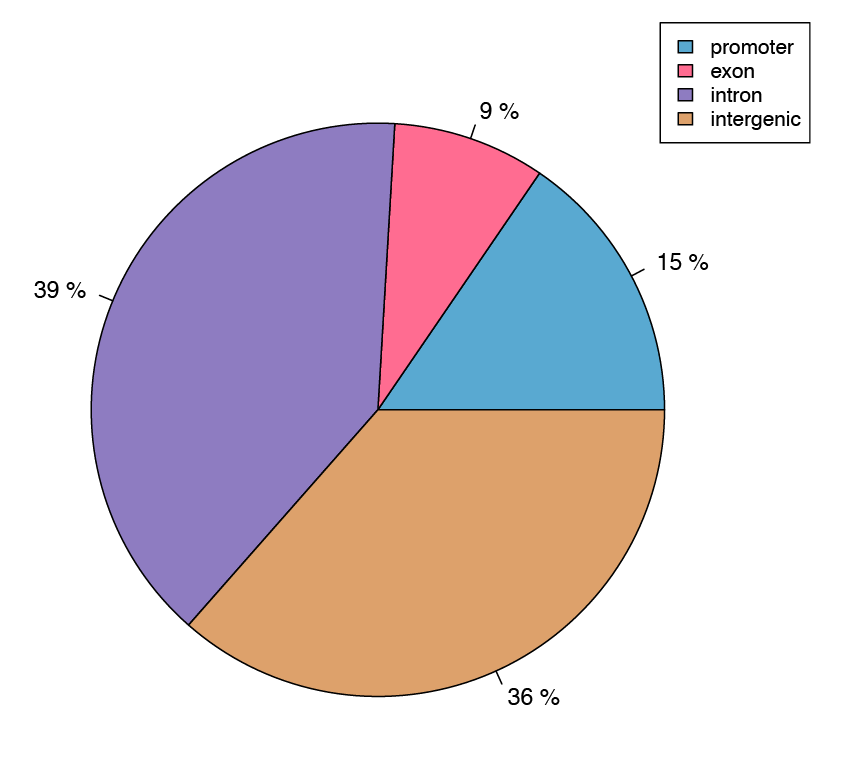
Fig. 4: 各遺伝子への差異分析によるメチル化シトシンの割合を示す円グラフ
CpG単位でメチル化の差異分析を行い、同定された部位をプロモーターやエクソンなどのアノテーションされた遺伝子の特徴にアライメントした。
RRBS Service 使用文献
Search our database of customer publications that have used our RRBS services.
RRBS Service 受託解析サービスの資料
RRBS Service Sample Submissionポータル
オンラインSample Submissionポータルは、解析したいサンプルの情報をアクティブ・モティフの担当者と共有し、依頼者には解析の進捗をご覧いただけるサイトです。 解析を依頼するために必要な連絡先、サンプルの情報、また解析の内容を記載していただきます。記載の方法や、サンプル提出方法について、ご不明な点がありましたら「[email protected]」までご連絡ください。