アクティブ・モティフのTranscriptionPathTMはRNAの発現をもとにした遺伝子発現解析法(RNA-Seqやルシフェラーゼアッセイ)とは異なるアプローチで遺伝子発現機構を解析する方法です。TranscriptionPathは、RNA pol IIが結合する遺伝子領域をゲノムワイドに解析するためのクロマチン免疫沈降(ChIP-Seq)をベースとした手法です。この方法は、RNAの半減期の影響を受けずに転写状態を解析することが可能です。また、同時に転写因子の結合状態も併せて観察することで、転写因子の結合と転写状態の変化をより詳細に解析することができます。
TranscriptionPath-Seqの受託解析内容
お客様には凍結組織または細胞ペレットをお送りいただきます。その後は弊社にて:
- クロマチンの調整およびソニケーション
- 抗RNA Pol II抗体を用いたクロマチン免疫沈降
- ChIP-Seqライブラリーの作製
- Illumina社の GA IIまたはHiSeqを用いた次世代シーケンシングの実施
- データ解析および納品
詳しくはTranscriptionPath Applications Noteをご覧いただくかEEpigenetic Services Information Requestまでお問い合わせください。また、Epigenetic Services Profileもダウンロードいただけます。
TranscriptionPath ChIP-Seq Service Sample Submissionポータル
オンラインSample Submissionポータルは、解析したいサンプルの情報をアクティブ・モティフの担当者と共有し、依頼者には解析の進捗をご覧いただけるサイトです。 解析を依頼するために必要な連絡先、サンプルの情報、また解析の内容を記載していただきます。記載の方法や、サンプル提出方法について、ご不明な点がありましたら「[email protected]」までご連絡ください。
| Name | Cat No. | 価格 (税抜) | |
|---|---|---|---|
| TranscriptionPath™ ChIP-Seq | 25220 | Get Quote |
Advantages of using TranscriptionPath to measure gene expression
- Measure transcription rates without the influence of RNA half-life.
- Ideal for measuring changes in gene expression at early time points (minutes).
- Detect alternate start sites and unannotated genes.
- Identify genes that are poised for transcriptional activation.
- Perform in parallel with transcription factor-targeted ChIP to correlate TF binding with changes in transcription.
TranscriptionPath can detect changes at early time points
Changes in gene expression occur within minutes of cell treatment but these changes are often ignored because most gene expression studies measure only much later time points. In order to truly understand a cellular response it is important to understand the primary response, that is, the changes that are happening within minutes of treatment. Measuring mRNA at these early time points has limitations as transcripts over 100 Kb will take over 1 hour to be fully transcribed, processed and exported to the cytoplasm where they can be detected. The TranscriptionPath method can detect gene expression changes that are missed by mRNA detection methods because it measures RNAPII occupancy at DNA in real time.
The examples in the figure below show that the TranscriptionPath-qPCR assay is more robust and can detect changes earlier in the time course than mRNA measurements by RT-qPCR.
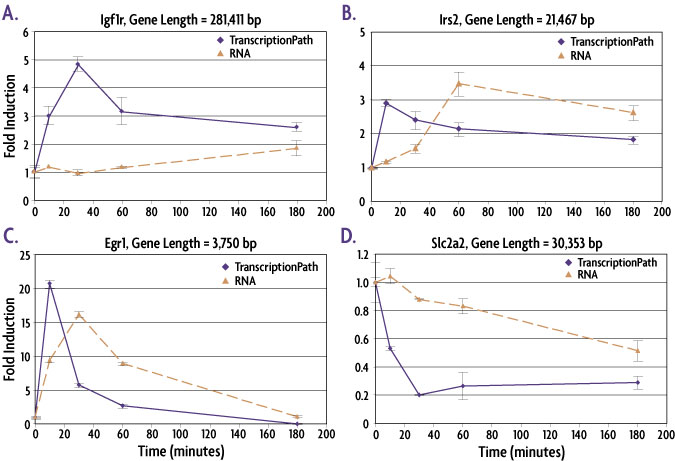
Figure 2: TranscriptionPath™ is better than mRNA methods at detecting changes in gene expression at early time points.
Mouse Min6 cells were treated with forskolin to induce changes in gene expression. Cells were fixed, chromatin prepared and TranscriptionPath-Seq analysis performed using qPCR primers approximately 1500 bp 3′ of the transcription start site (TSS). Total mRNA was measured by preparing cDNA and designing primers that span splice junctions. Igf1r (A), Irs2 (B) and Egr1 (C) are all genes for which induced transcription was detected. For all of these genes the peak in transcription is detectable before the peak in mRNA and the data shows that the longer a gene is, the farther the peak in mRNA lags behind the peak in transcription (compare A to C). TranscriptionPath also enables earlier detection and more dramatic differences for the down-regulated gene Slc2a2 (D) with the most dramatic decrease in transcription observed at 30 minutes compared to 3 hours for RT-qPCR measurements.
TranscriptionPath in combination with TF ChIP
ChIP is widely used to detect transcription factor binding or histone modifications. ChIP-Seq is a combination of ChIP followed by Next-Gen sequencing that enables TF binding and modified histone occupancy to be be mapped across the entire genome. However, mapping binding sites lacks contextual information because the process of TF binding does not always lead to transcriptional activation or repression. In order to more fully understand the importance and/or function of individual TF binding events it is necessary to understand the effects of TF binding on transcription of each bound gene. This type of analysis can be achieved by integrating ChIP-Seq data with TranscriptionPath-Seq gene expression data.
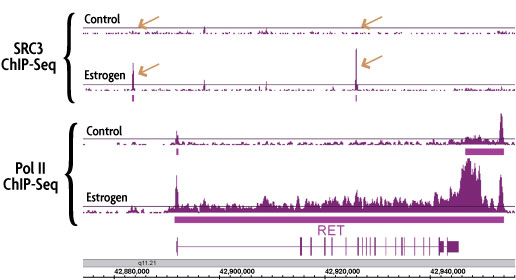
Figure 3: Induced TF binding correlates with TranscriptionPath™-measured gene expression.
Performing ChIP-Seq using an antibody against RNA pol II produces a genome-wide profile of gene transcription rates. ChIP-Seq was performed using chromatin from control and estrogen-treated MCF-7 cells and antibodies against RNA Pol II and the estrogen-inducible transcription factor SRC3. Estrogen treatment induced the binding of SRC3 in the promoter and gene body of the RET gene (copper arrows in top 2 panels). Induced SRC3 binding correlates with induced transcription of the RET gene as measured by TranscriptionPath (bottom 2 panels).
TranscriptionPath can identify alternate start sites and unannotated genes
30-50% of all human genes use alternate transcription start sites. Using the TranscriptionPath method for gene expression studies has the added advantage of providing information on transcription start sites (TSSs). These alternate TSSs can occur within the existing annotation or far upstream of the annotated start site. Often the identified alternate TSS can be verified by searching additional gene databases. Additionally, TranscriptionPath has the ability to detect transcription of unannotated genes. The two examples below illustrate ways in which TranscriptionPath data is rich in additional biological information that goes beyond simply measuring transcription rates.
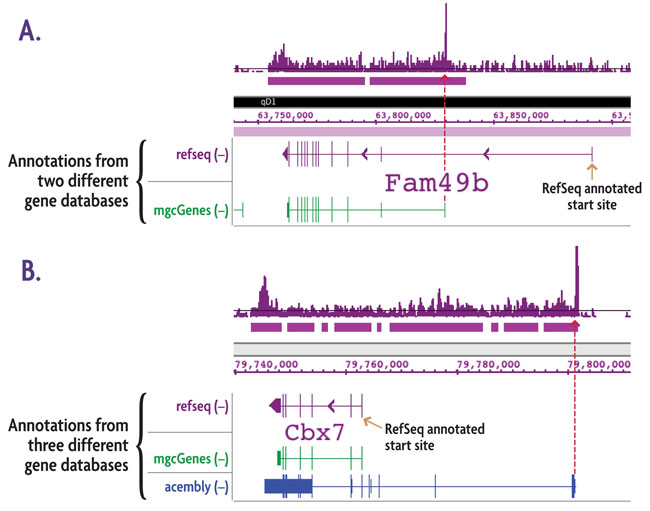
Figure 4: Alternate transcription start sites (TSSs) revealed by TranscriptionPath™.
TranscriptionPath-Seq was performed using chromatin from a mouse neuroblastoma cell line. The data presented above is from two genes with transcription initiation in areas of the genome that do not correspond to their respective start sites in the RefSeq gene database (purple gene annotations). A. Comparison to an alternate gene database (mgcGenes, green gene annotation) reveals a known alternative transcription start site for Fam49b that corresponds to the transcription start site detected with TranscriptionPath. B. Comparison to the RefSeq and mgcGenes databases shows the same annotations for Cbx7, but comparison to a third gene annotation database (Acembly Genes, blue gene annotation) reveals a known alternative start site for Cbx7 that corresponds to the transcription start site detected with TranscriptionPath. The red arrows show that the start sites from the alternate gene databases correspond precisely with location of paused RNAPII.
The following papers cite the use of and/or provide additional information about TranscriptionPath™ Services provided by Active Motif’s Epigenetic Services:
- “Dynamic O-GlcNAc cycling at promoters of Caenorhabditis elegans genes regulating longevity, stress, and immunity” by Love et al (2010) Proc. Natl. Acad. Sci. USA 107(16):7413-7418.
- “Identification of target genes in breast cancer cells directly regulated by the SRC-3/AIB1 coactivator” by Labhart et al (2005) Proc. Natl. Acad. Sci. USA 102(5):1339-1344.
- “GATA4 expression is primarily regulated via a miR-26b-dependent post-transcriptional mechanism during cardiac hypertrophy” by Han et al (2012) Cardiovasc Res 93(4):645-654.
- “The Transcription Factor Neural Retina Leucine Zipper (NRL) Controls Photoreceptor-specific Expression of Myocyte Enhancer Factor Mef2c from an Alternative Promoter” by Hao et al (2011) JBC 286(40):34893-902.
- “Global Characterization of Transcriptional Impact of the SRC-3 Coregulator” by Lanz et al (2010) Molecular Endocrinology 24(4):859-872.